











The topic in a nutshell
- Customer loyalty increases profitability: According to Bain & Company , increasing customer loyalty by 5% can boost profitability by up to 75%.
- Retention rate as program proof: Mature loyalty programs achieve a 55–75% retention rate; the retail average is significantly lower.
- CLV uplift through loyalty: Active program members typically achieve a 20–45% higher customer lifetime value than comparable customers not in the program.
- From measuring to managing: Convercus calculates CLV, retention rate, and churn signals in real time and automatically triggers the right actions before customers churn.
Many loyalty programs have hundreds of thousands of registered members, yet hardly anyone in the company knows how many of them haven't made a purchase in months. If you don't measure, you don't react; if you don't react, you lose customers quietly. This guide outlines the three KPIs that retail decision-makers need to know and track systematically, and provides concrete steps to take when these metrics fall below your target range.
Standard reporting isn't enough: The three loyalty KPIs that actually matter
Most loyalty reporting stacks provide the same numbers: program registrations, points issued, and rewards redeemed. These metrics only show what is happening within the loyalty program, not how the program has actually changed customer purchasing behavior.

The fundamental problem lies in confusing activity metrics with outcome metrics. An increase in point redemptions might indicate an effective program, or it could simply be the result of a short-term marketing campaign that generated temporary attention. If you can't distinguish between the two, you're pulling the wrong levers for optimization.
The three KPIs that truly matter form a causal chain:
- Customer Lifetime Value (CLV) is the overarching metric: it measures the cumulative value of a customer over the entire duration of the relationship.
- Customer Retention Rate is the direct driver of CLV: the higher the retention rate, the longer the customer relationship, and the higher the CLV.
- Churn Rate is the early warning system: it shows how many customers are currently drifting away before the effect becomes visible in the CLV.
One other critical point: If you measure KPIs without a control group, you will mistakenly attribute external factors to your program. Only by comparing program participants with a comparable group of non-participantscan you measure the actual impact of the program. A robust customer retention strategy starts right here: not with more activity, but with better measurement.
Customer Lifetime Value (CLV): The overarching metric for every loyalty program
CLV answers the strategically critical question: How much is a customer worth over the entire duration of the relationship? The answer determines how much can be invested in acquisition and retention.
The simplest reliable formula for retail decision-makers:
CLV = Avg. order value × purchase frequency per year × customer retention period × gross margin
More meaningful for a loyalty context is the differential CLV: the difference between the CLV of active program participants and the CLV of a comparable control group without the program. This value does not measure what a customer is worth, but rather what the program contributes. In practice, evaluations show typical CLV increases of 20–45% among active participants.
As a health check, we recommend the CLV:CAC ratio (Customer Acquisition Cost): A value of 3:1 is considered healthy, meaning the customer generates three times as much gross profit as it cost to acquire them. Below 2:1, the company is burning capital.
CLV calculation example: Retail
With a CLV uplift of 30% through the loyalty program, this value rises to €374, an additional revenue of €86 per customer over three years.
Customer Retention Rate: The most direct proof of program success
The Customer Retention Rate (CRR) directly measures whether customers return because of the program. It is the closest proxy for program impact in day-to-day operations.
Calculation formula:
CRR = ((Customers at end of period – new customers during period) / customers at start) × 100
Example: If a company starts with 1,000 customers, gains 200 new customers, and ends with 1,050 customers, the CRR is ((1,050 – 200) / 1,000) × 100 = 85%.
Recommended measurement interval: rolling 12 months. Shorter windows are distorted by seasonality and promotional periods. Longer windows react too slowly for operational management decisions.
DACH benchmarks for retail:
- Mature B2C loyalty programs: typically 55–75%
- Retail DACH: typically 55–70%
- Global retail: average of around 63%
An often overlooked distinction: Retention rate vs. repurchase rate. The retention rate excludes new customers and is measured over a rolling 12-month period. The repurchase rate includes all customers and is better suited for short-term analysis. For loyalty managers, the retention rate is more meaningful because it isolates the existing customer base.
What should you do if the retention rate is too low?
If the rate is below 50%, structural measures are necessary:
Step 1: Evaluate program attractiveness
Are the rewards relevant to your target audience? Are the redemption thresholds achievable? Point thresholds that are too high lead to frustration rather than loyalty.
Step 2: Test communication frequency and relevance
Trigger-based campaigns that rely on individual purchasing behavior consistently achieve better retention rates than broadcast communication, thanks to marketing automation .
Step 3: Establish a control group
Compare participants with non-participants under the same conditions. Only then will you see whether the program is actually influencing the retention rate or if external factors (seasonality, new product launches) are the deciding factor.
Churn rate: An early warning signal for silent attrition
The churn rate is the counterpart to the retention rate: it measures how many customers become inactive or leave within a defined period. Mathematically, retention rate + churn rate = 100%. Keeping an eye on both helps you identify problems earlier.
Calculation formula:
Churn rate = (customers lost during the period / customers at the start) × 100
Benchmarks for retail: Annual churn rates of 20–37% are common in global retail. The difference is more meaningful than the absolute value: active loyalty program participants typically show a 15–30% lower churn rate than comparable non-participants. If this difference is below 15%, the program has structural weaknesses.
Important: Don't wait for the churn rate to rise if the following early warning signs appear:
- Purchase gaps of more than 60 days among previously active members
- Drop in Net Promoter Score (NPS): Programs with an NPS above 30 are proven to have lower churn rates
- Increase in support requests regarding rewards or redemption issues
- Declining activation rates within specific customer segments
Activation rate and redemption rate as operational supplements
Two KPIs react earlier than retention rate or CLV and are suitable as leading indicators:
Activation rate: Percentage of registered members who have been transactionally active within the last six months. Target for mature programs: over 50%. In retail, this value is approximately 42–58%, depending on the industry.
Redemption rate: Percentage of points collected that are actually redeemed. Target range: 40–65%. Too low means: rewards are unattractive or thresholds are too high. Too high means: the program budget is under pressure.
Which measurement errors are ruining your loyalty reporting?
Even well-intentioned KPI measurements can lead to false conclusions. The four most common mistakes in practice:
How Convercus uses your KPIs as steering signals
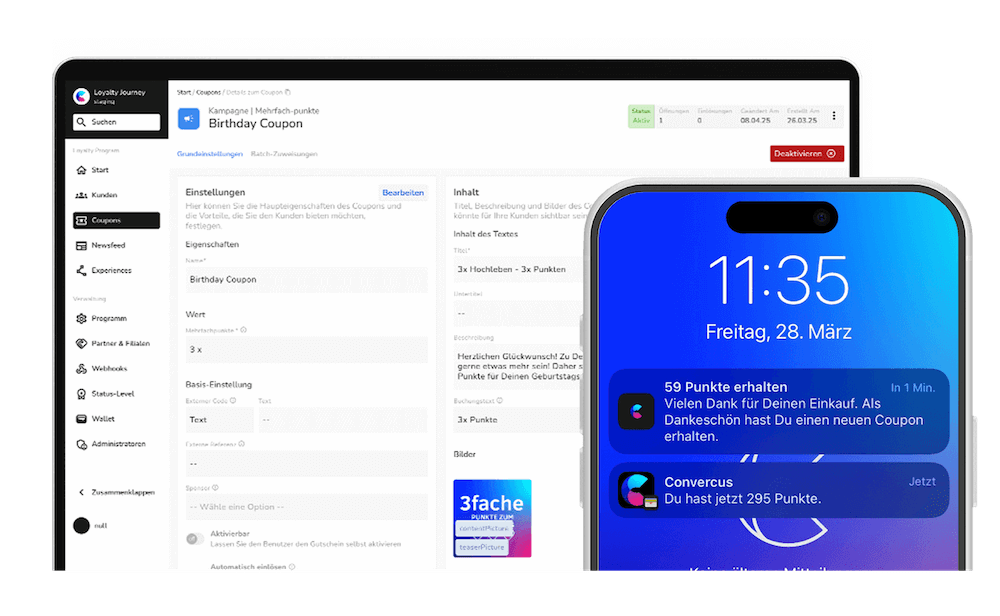
The difference between a reporting dashboard and a loyalty engine lies not in the visualization, but in the responsiveness. Convercus doesn't just calculate CLV, retention rate, and churn signals—it uses them as triggers for automated actions.
Specifically, this means:
- Real-time segmentation: Customers at risk of churning are identified before they become inactive, based on purchase gaps, NPS trends, and activation data.
- Tier upgrades when status loss is imminent: Automatic bonus points or rewards when a member is about to lose their status, supported by Gamification mechanics.
- Reactivation campaigns for lapsed customers: Trigger-based communication after 60 days of inactivity, personalized based on previous purchase behavior, as part of a structured customer win-back strategy.
- Bonus mechanics for CLV below target: Segment-specific incentives for customers whose CLV is below the program average.
The Convercus Loyalty Engine manages over 40 million loyalty accounts and processes 20,000 connected POS systems. Across all programs, Convercus delivers an average 5x return on investment, as well as an increase in average order value of up to 134% and a repeat purchase rate increase of up to 274%, particularly in retail.

Loyalty KPIs as a management tool: How to maximize your program ROI
CLV, retention rate, and churn rate function as a system. No single KPI is enough: measuring only the churn rate reveals the problem but not the monetary value. Measuring only the CLV shows the result but not the driver. Only by looking at them together do you get a complete picture of the program's value.
Anyone who regularly measures all three KPIs, consolidates them into a dashboard, and analyzes deviations by segment can reliably demonstrate program ROI and use that to justify budgets, increase investment, and strategically expand the program. That is the difference between a loyalty program that generates costs and one that funds growth.
KPI measurement is not an end point, but the starting point for a self-optimizing program. For companies currently in the process of launching a loyalty program, KPI measurement is the decisive success factor from day one. Convercus makes exactly that possible: the platform connects the measurement and management layers, so that declining KPIs are not only visible but automatically trigger the right responses.
FAQ
How do retail CRM managers calculate the customer retention rate for their loyalty program?
The formula is: CRR = ((customers at end – new customers) / customers at start) × 100. The measurement interval is crucial: use a rolling 12-month period, not a monthly one. Short windows are distorted by seasonality. New customers are explicitly excluded because the retention rate is intended to reflect only the repeat purchase behavior of existing customers, not the growth of the total customer base.
What is a realistic CLV benchmark for omnichannel retailers in Germany?
An absolute benchmark is not very meaningful, as CLV depends heavily on basket size, purchase frequency, and margin. The differential CLV is more informative: active program participants typically achieve a 20–45% higher CLV than comparable non-participants. As a health check, a CLV:CAC ratio of at least 3:1 is considered healthy and signals that the program is scaling profitably.
What churn rate is acceptable for retail loyalty programs?
In global retail, annual churn rates are between 20–37%. More meaningful than the absolute value is the difference between program participants and non-participants: well-functioning programs show a 15–30% lower churn rate among active members. If the difference is lower than that, structural program weaknesses should be investigated.
What is the difference between retention rate and repeat purchase rate for retail loyalty managers?
The retention rate explicitly excludes new customers and measures over a rolling 12-month window: it is the more precise indicator of the program's retention effect on existing customers. The repeat purchase rate includes all customers and is suitable for shorter-term evaluations, such as on a monthly basis. Loyalty managers need both: the retention rate for strategic program management and the repeat purchase rate for operational campaign evaluation.
How can a loyalty manager identify early on that program participants are churning?
The churn rate shows churn in retrospect. Early warning signals are more informative because they react sooner: purchase gaps of more than 60 days among previously active members, a declining NPS (programs with an NPS above 30 demonstrably show lower churn rates), an activation rate falling below 30%, and an accumulation of support inquiries regarding rewards or redemption issues. Proactive trigger communication based on these signals prevents churn before it becomes measurable in the churn rate.
Convercus automatically calculates CLV, retention, and churn signals and triggers the right actions before customers churn.

- Control group comparison instead of gut feeling
- Segmented KPI analysis instead of averages
- Early indicator monitoring instead of reactive adjustments
→ With Convercus, you have the right levers at your fingertips.
.png)


.png)